Product
Introducing Lattik Studio: An Agent-First Data Platform
Where agents don't just answer questions — they set up tables, configure pipelines, and query results. A look at the architecture.
The last post made the case that AI agents fail at data not because the agents are bad, but because the data layer wasn't built for them. Table sprawl, duplicated columns, silent definition drift — the mess underneath makes it nearly impossible for an agent to reason correctly.
This post introduces what we're building to fix that: Lattik Studio — an open source, agent-first data platform for setting up, managing, and querying data.
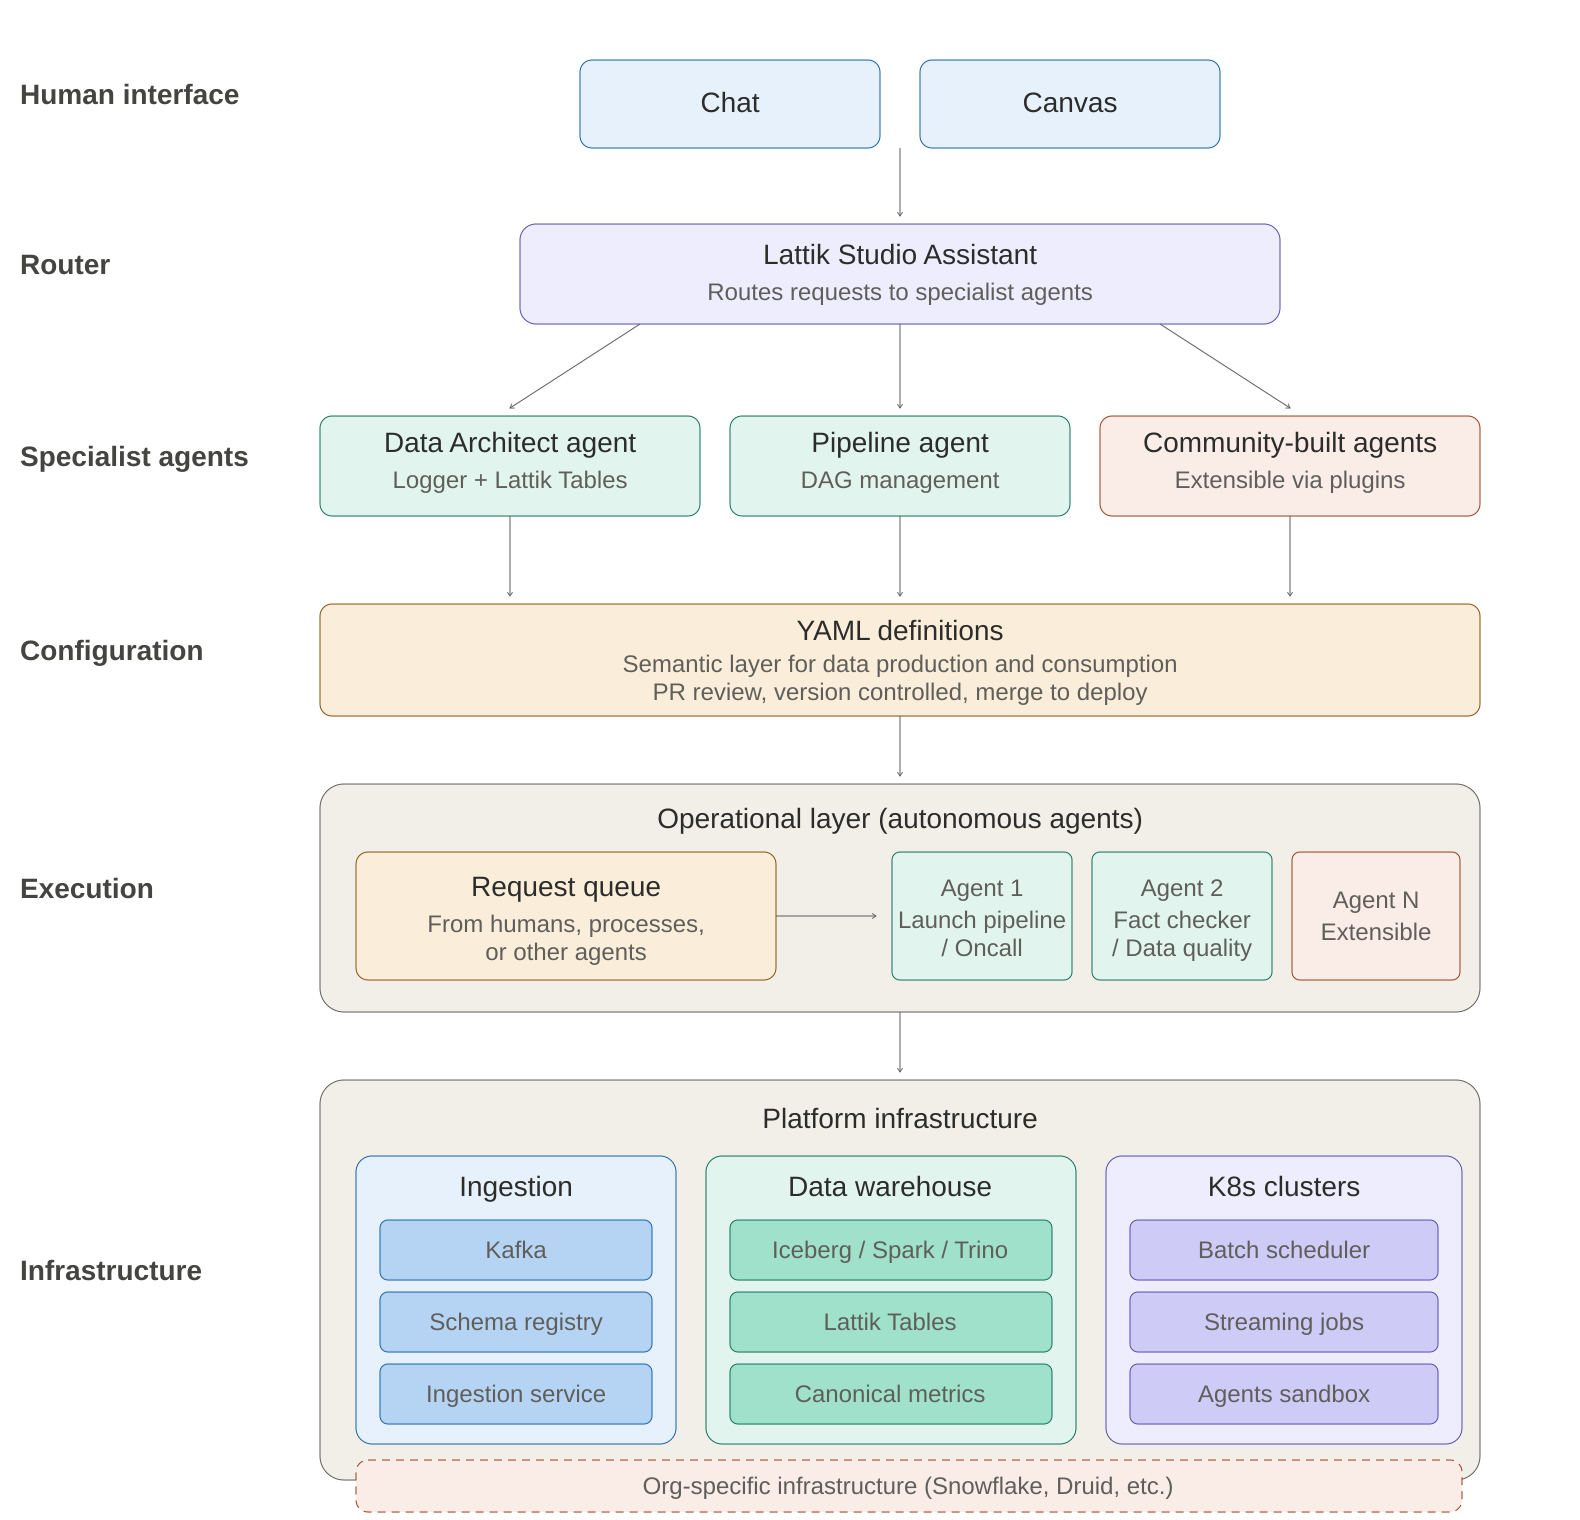
What Do We Mean by "Agent-First"?
Most data platforms were designed for humans writing SQL and clicking through UIs. Agents were added later — bolted on as a "chat with your data" feature on top of infrastructure that was never built for them.
Lattik Studio takes the opposite approach. Agents aren't limited to answering questions — they can set up tables, configure pipelines, monitor execution, and query results. The platform is designed from day one to make this possible. Every layer of the stack has an agent-accessible interface: definitions are expressed as structured YAML that agents can read and generate, the canvas provides a surface for agents to present interactive content, and the plugin system lets agents be extended with domain-specific knowledge and tools.
The Interface: Chat + Canvas
The primary interface to Lattik Studio is a conversation with the Lattik Studio Assistant. You talk to it the same way you'd talk to a colleague on the data team. Under the hood, the assistant is a router — it understands your request and delegates it to the right specialist agent, whether that's a Data Architect agent for table design, a Pipeline agent for DAG management, or a community-built plugin agent for domain-specific workflows.
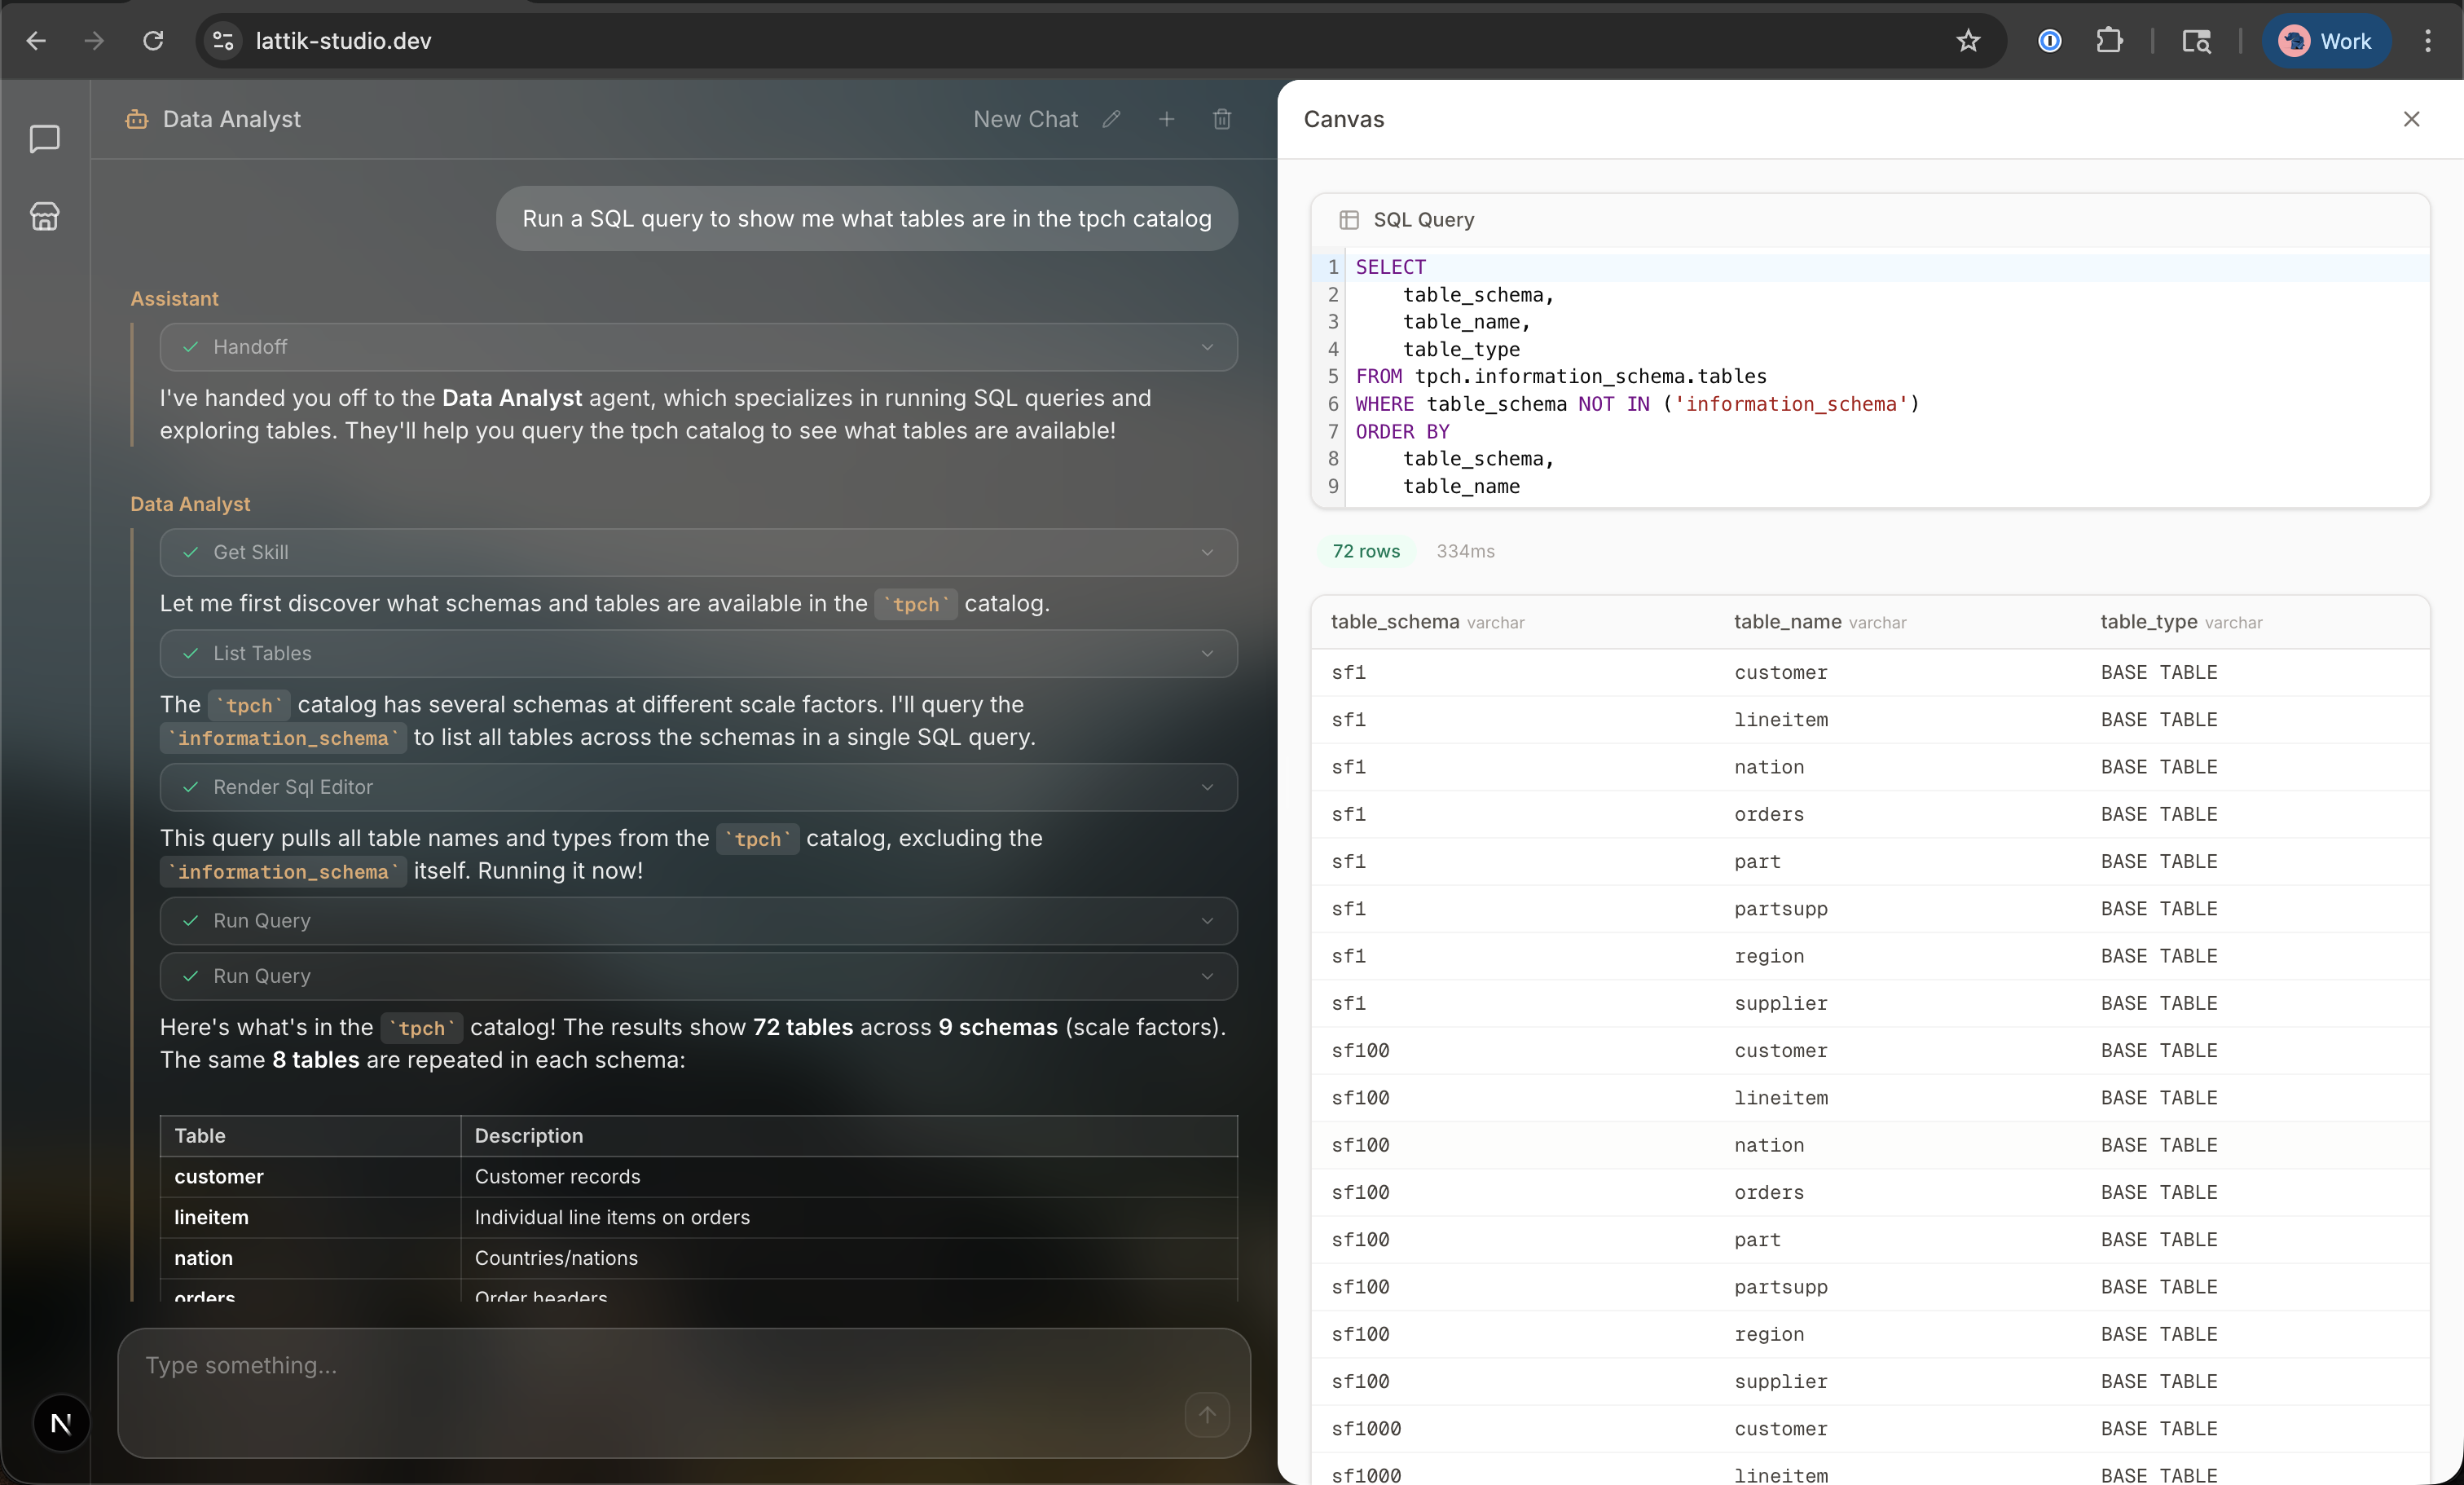
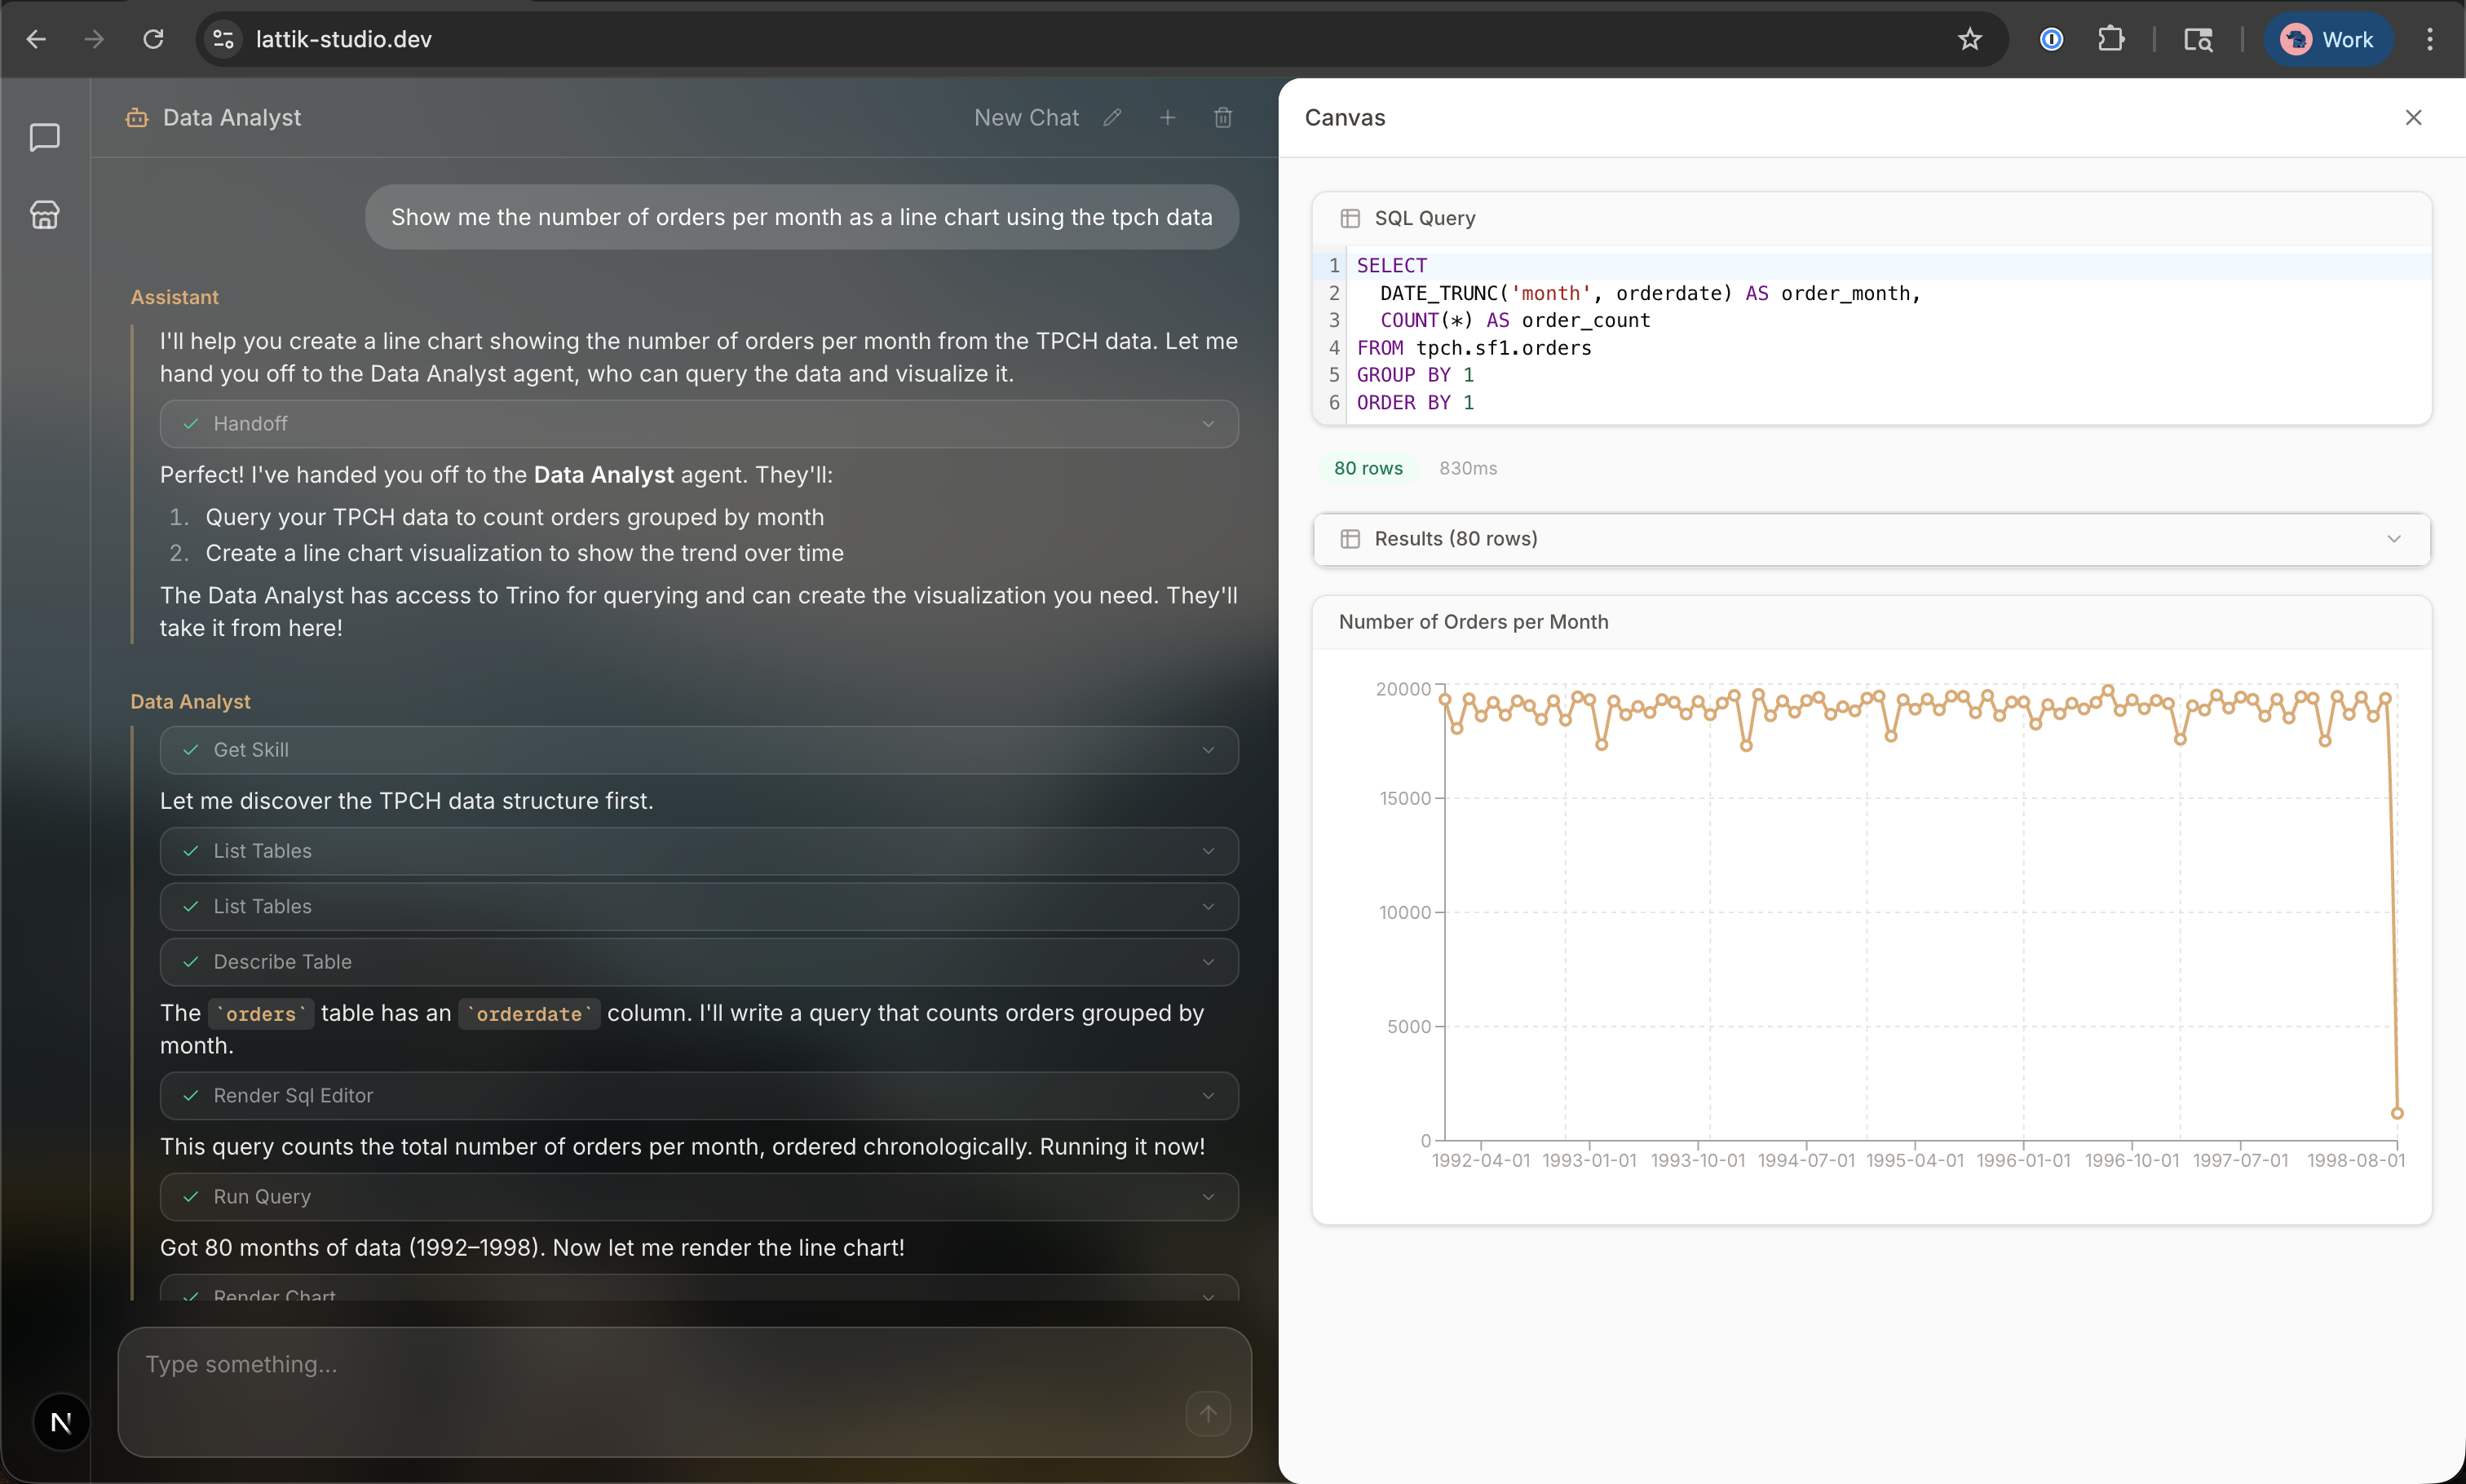
The canvas is the companion to the chat — a flexible surface where the agent can display interactive content to support the conversation. When you're designing a table, the canvas shows the definition and a preview of the table. When you're monitoring a pipeline, it shows the DAG status. When you're querying data, it shows the results.
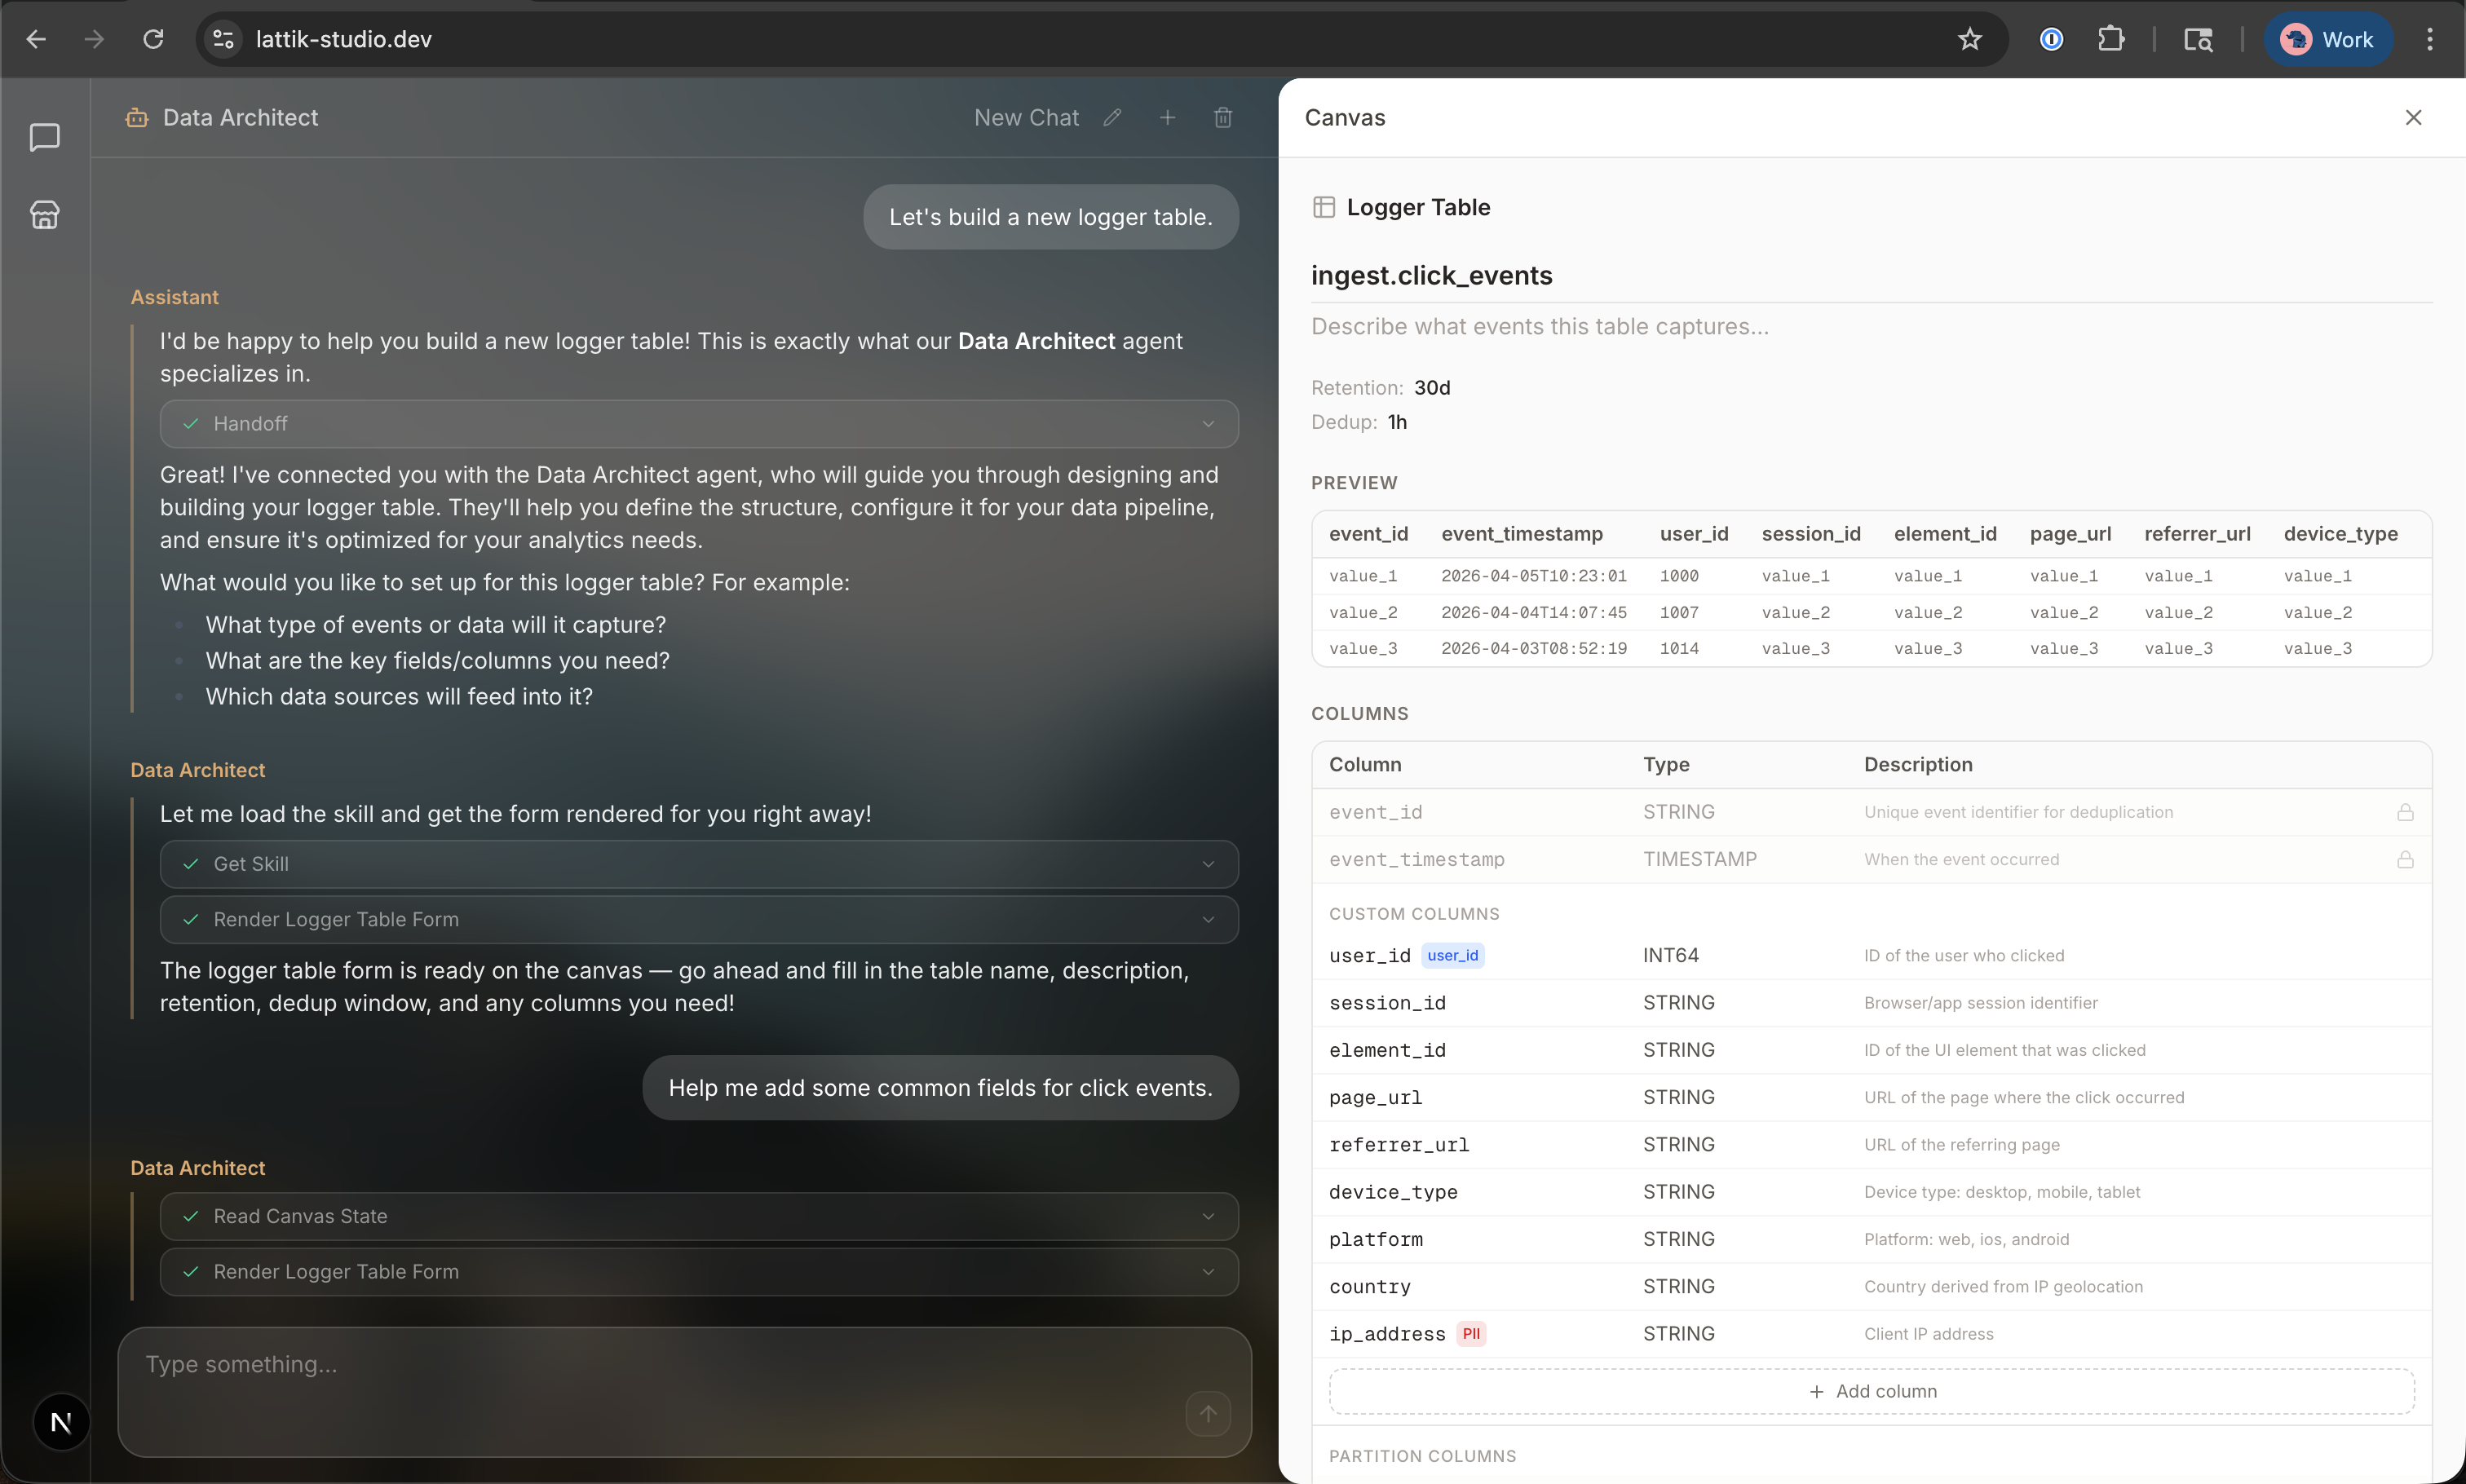
Here's an example: a user asks to build a new logger table. The assistant routes the request to the Data Architect agent, which walks through the design and renders an interactive form on the canvas.
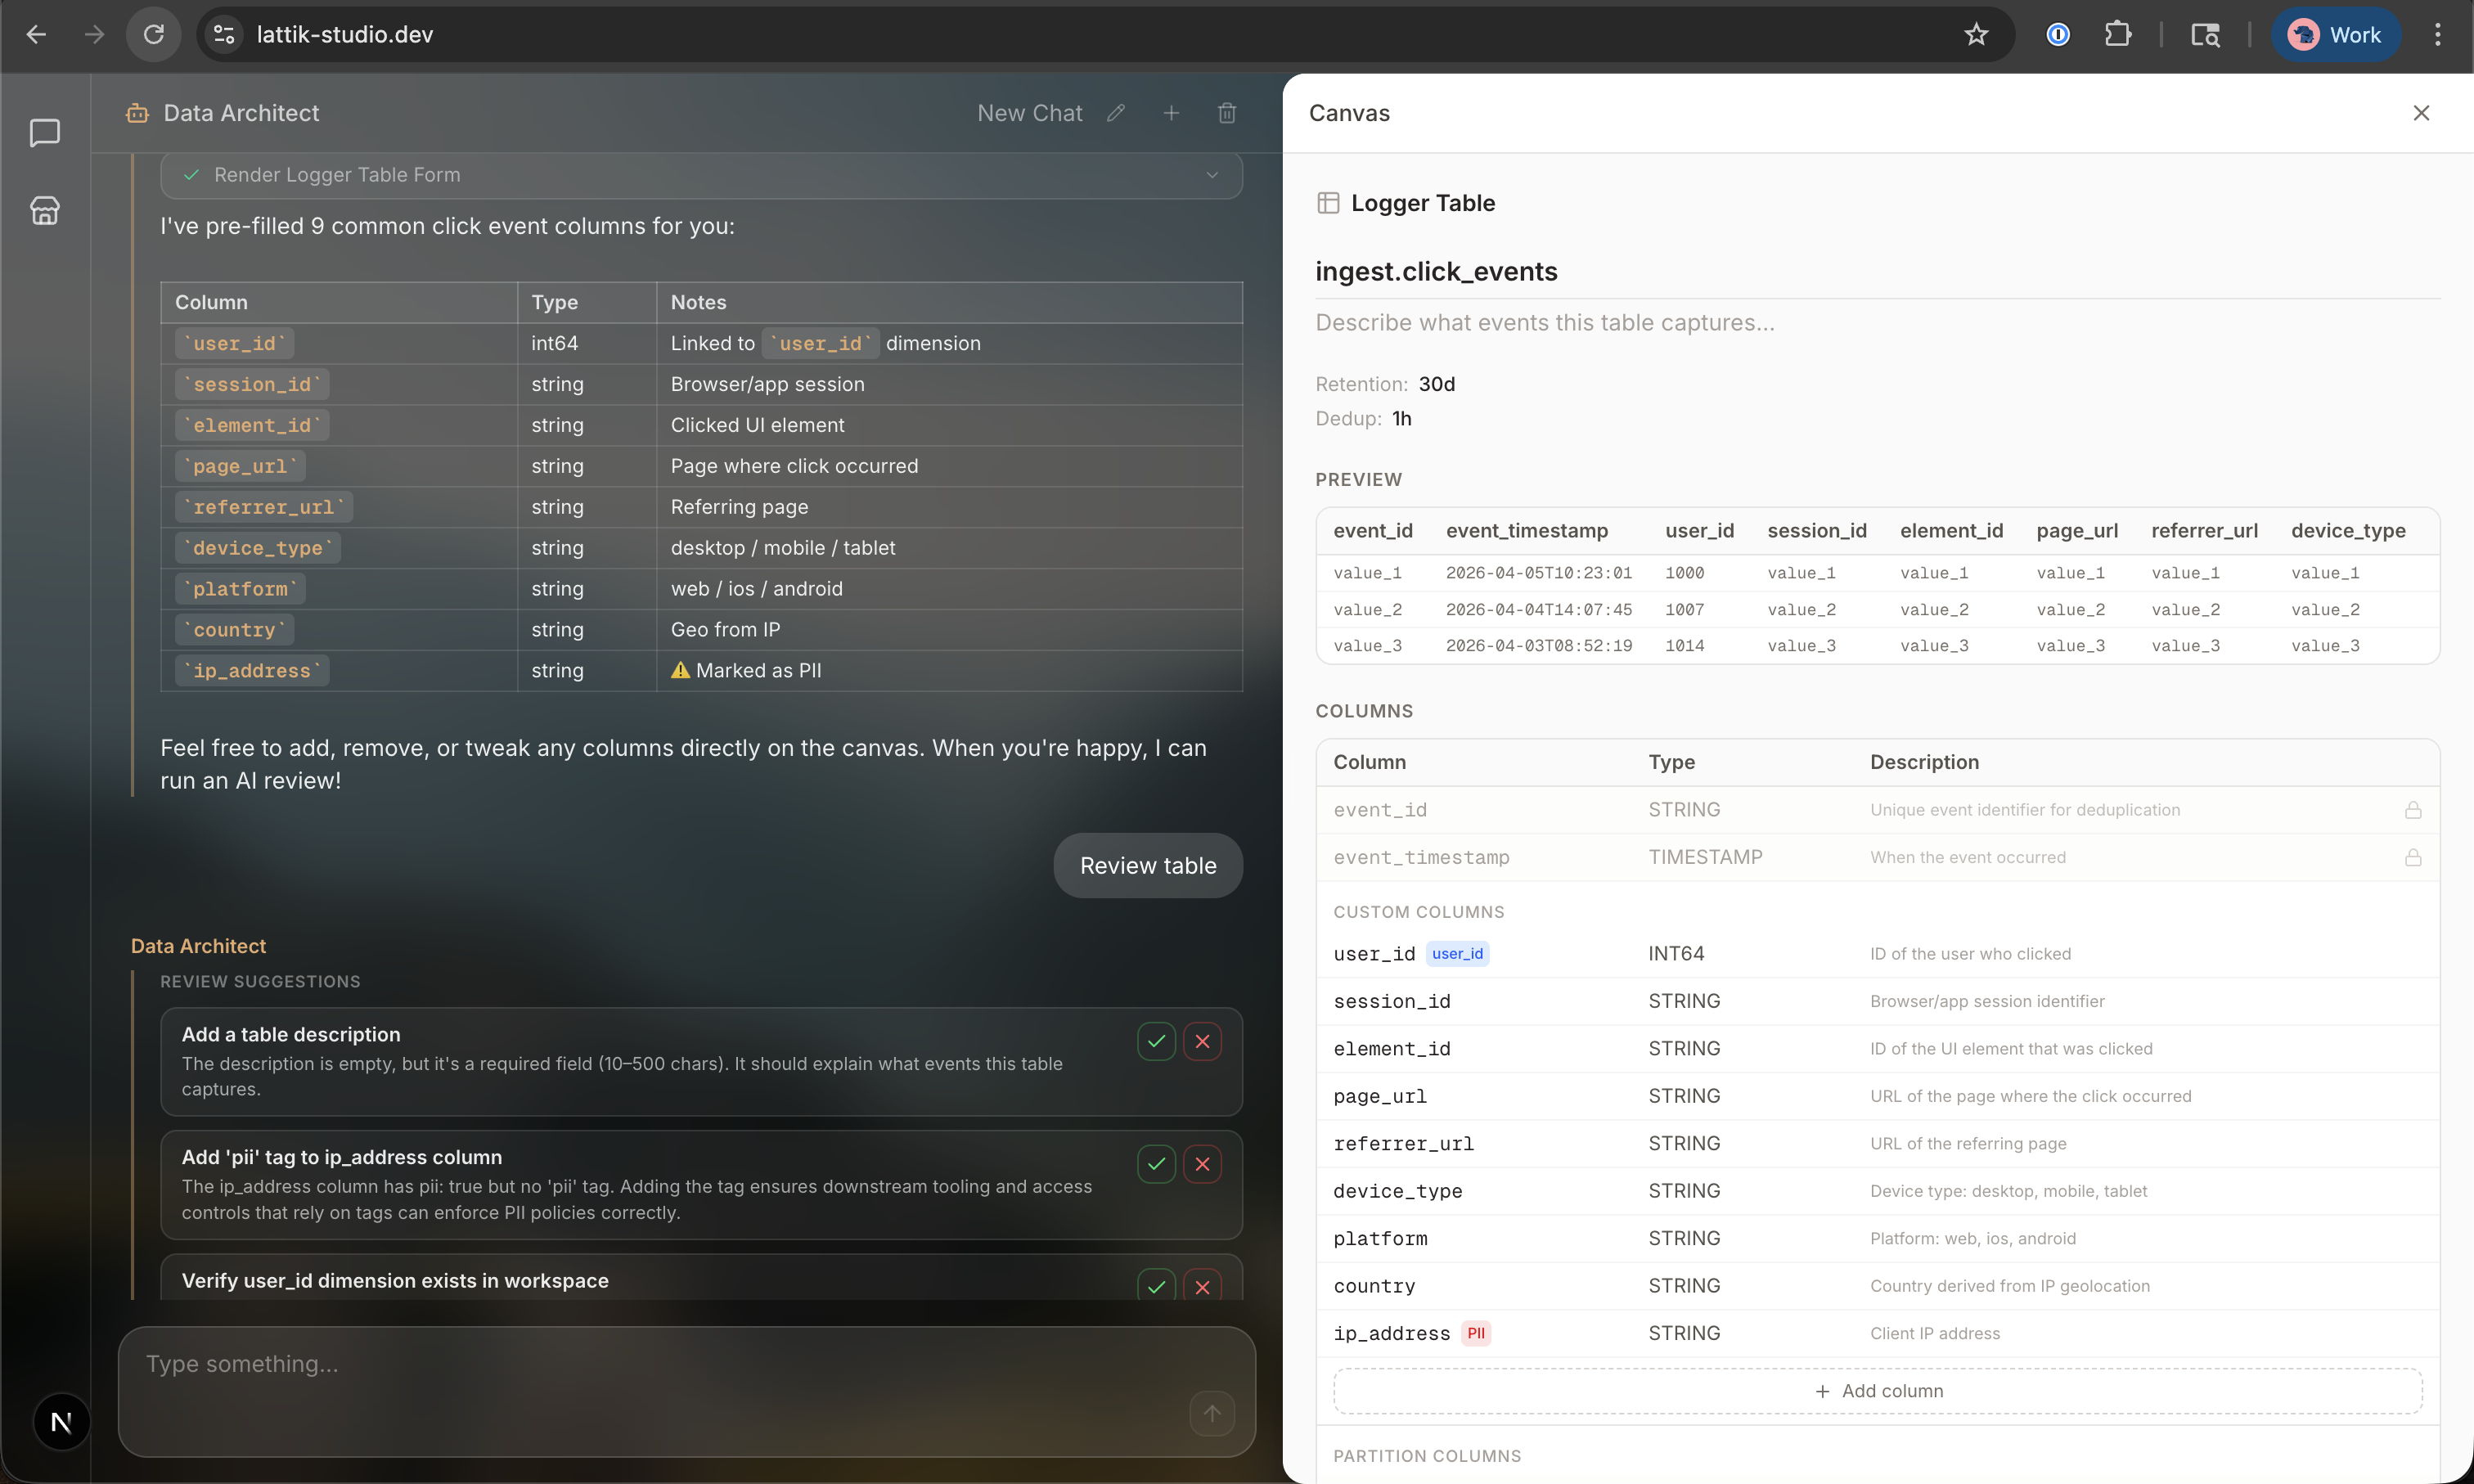
The agent can also pre-fill common fields and run an AI review to catch issues — like a missing table description or a PII column that needs tagging.
What the Platform Provides
Lattik Studio isn't just a chat wrapper. It's a full data platform with these core components:
Data ingestion infrastructure. The plumbing to get data into the system — logger tables that capture raw events and feed downstream processing.
Lattik Tables. The super wide tables from the last post. Multiple teams contribute columns independently, each on their own schedule, with no joins and no coordination overhead. If you haven't read the last post, the short version: a single table that multiple teams can write to without stepping on each other. We'll have a dedicated post on how Lattik Tables work under the hood.
Canonical dimensions and metrics. Given a name, there's one and only one definition. No ambiguity. Because the platform knows where each metric lives, queries against canonical metrics don't need a FROM clause — and they can be pre-aggregated behind the scenes for faster results.
Declarative pipeline definitions. You describe what you want, not how to build it. Every configuration is a YAML file bound to a pre-defined schema — define a table's schema and column groups, and the platform figures out the pipelines, scheduling, and execution. If you've used Terraform or Next.js, the mental model is the same. Together, these definitions form the semantic layer for both data production and data consumption. They go through a standard code review process: create a PR, get it reviewed, merge it. Nothing takes effect until it's merged.
Operationalization. Once a PR is merged, operational agents running in the background pick up the definitions and operationalize them — whether that means generating a batch DAG, launching a streaming pipeline, or executing a custom workflow defined by a plugin. Airflow is the first supported batch scheduler, but the platform is scheduler-agnostic.
Chat-based operations. Humans can monitor and control pipeline execution through the same chat interface and canvas. No switching to a separate Airflow UI.
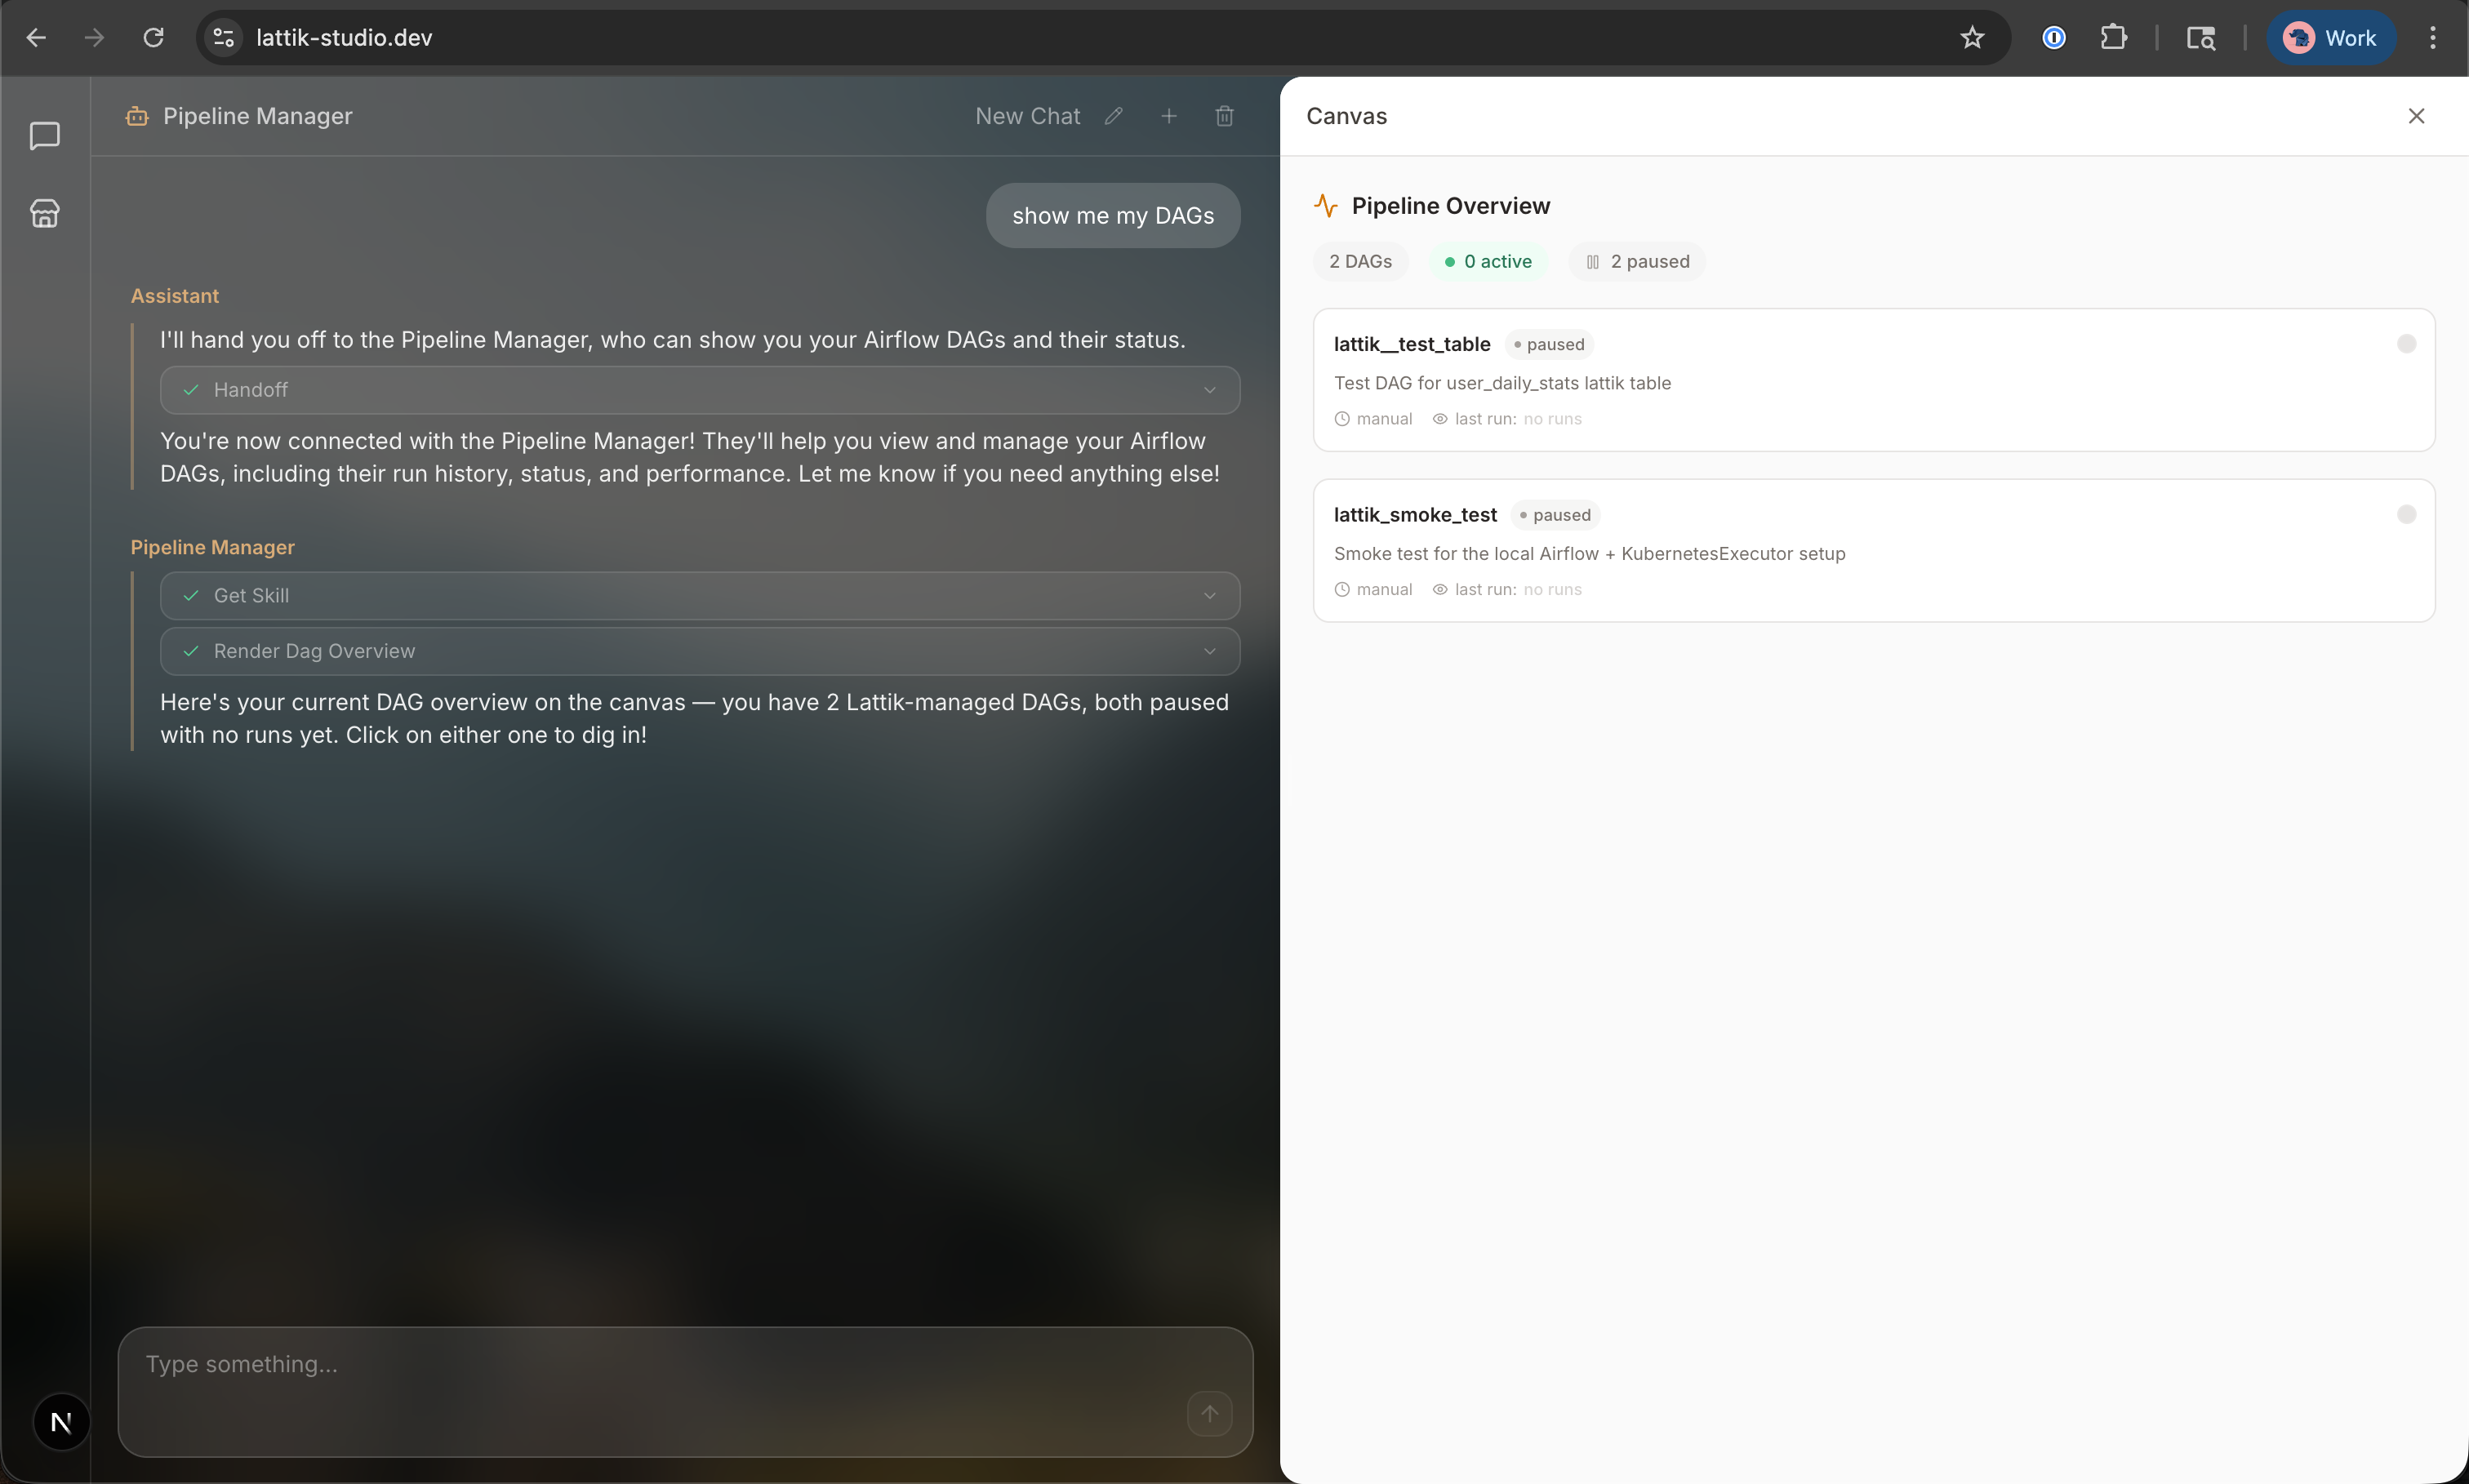
Data querying. Once the data has landed, humans can ask questions in the chat interface and get results back directly. The canvas can render charts, tables, and other visualizations alongside the conversation — from table design to data consumption, all in one place.
The Agent Plugin System
The platform ships with core agents and tools that cover the fundamentals — setting up tables, managing pipelines, running queries. But every data team has domain-specific needs.
That's where the plugin system comes in. Contributors can build new agents that use existing platform tools, or build new tools that any agent can pick up. A new agent might combine the YAML generation tool, the canvas rendering tool, and the query tool with its own conversation flow, domain knowledge, and memory to accomplish something the core platform never anticipated.
A contributor building a Growth Analyst agent, for example, would define:
- Inputs — defined by a YAML schema, like function arguments. Which product, which time window, which user segments — depending on what's provided, the agent behaves differently
- Canvas components — what interactive content the agent displays: retention charts, cohort tables, funnel visualizations
- Outputs — what the agent delivers: a report, a dashboard, a set of query results
- Knowledge and memory — each agent has its own knowledge base and memory system
Not all agents need to be interactive. A DAG oncall agent might monitor pipelines around the clock, or an ML model builder might continuously retrain a model in the background. The operational agents are pluggable too — contributors can define new ones for their custom infrastructure or workflow needs.
In short: the platform provides the infrastructure, the tooling, and the plugin API. The plugins provide the domain expertise.
Why Open Source?
The problems described in the last post aren't unique to any one company. Every data team hits some version of the same sprawl — but the specifics vary widely. We want to learn from as many of those use cases as possible.
Lattik Studio is open source under the Apache 2.0 license. The platform, the built-in agents, the plugin API — all of it. We want to build a community where data engineers, ML engineers, and data scientists can contribute agents for their own use cases and share them with others.
The project is in active development. If you're interested, check it out at github.com/Eloquio/lattik-studio.
In future posts, we'll dive deeper into individual platform components.